Nowadays, a daily increase of online available data leads to a growing need for that data to be organized and regularized. Textual data is all around us starting from web pages, e-books, media articles to emails or user comments. There are a lot of cases where automatic text classification would accelerate processing time (for example, detection of spam pages, personal email sorting, tagging products or document filtering). We can say that all organizations (e.g. academia, marketing or government) that deal with a lot of unstructured text, could handle that data much easier if it was standardized by categories/tags.

Text classification or text categorization is an activity of labelling natural language texts with relevant predefined categories. The idea is to automatically organize text in different classes. It can drastically simplify and speed-up your search through the documents or texts!
Imagine, you own a large e-commerce website which shows relevant products to a user based on his/her search and preferences. Every time you want to add new products you have to read their descriptions and manually assign a category to them. This procedure can cost you too much time and money, especially if you have a high fluctuation of the available products. But, if you develop an automatic text classifier, you can easily add many new products and tag them automatically without actually reading the descriptions! You can also create a classifier to link search texts to the item categories for a better user experience.
How to build a text classifier
Explore the data – general statistics
First, you need to have an annotated dataset to train and test your classifier. For this propose, we will use a “20 Newsgroup” corpus available in scikit-learn; we will get the data with fetch_20newsgroups():
from sklearn.datasets import fetch_20newsgroups
news = fetch_20newsgroups(subset='all')

print("Number of articles: " + str(len(news.data)))
print("Number of diffrent categories: " + str(len(news.target_names)))

news.target_names
Output:
Number of articles: 18846
Number of diffrent categories: 20

['alt.atheism',
'comp.graphics',
'comp.os.ms-windows.misc',
'comp.sys.ibm.pc.hardware',
'comp.sys.mac.hardware',
'comp.windows.x',
'misc.forsale',
'rec.autos',
'rec.motorcycles',
'rec.sport.baseball',
'rec.sport.hockey',
'sci.crypt',
'sci.electronics',
'sci.med',
'sci.space',
'soc.religion.christian',
'talk.politics.guns',
'talk.politics.mideast',
'talk.politics.misc',
'talk.religion.misc']

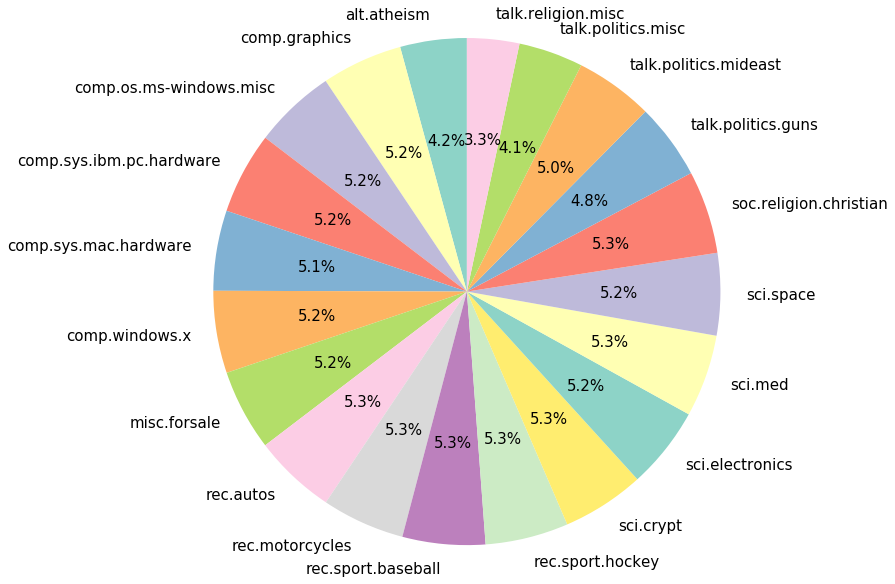
As you can see, there are 18 846 newsgroup documents, distributed almost evenly across 20 different newsgroups. Our goal is to create a classifier that will classify each document based on its content. Let’s see the content of one document:
print("\n".join(news.data[1121].split("\n")[:]))
Output:
From: et@teal.csn.org (Eric H. Taylor)
Subject: Re: Gravity waves, was: Predicting gravity wave quantization & Cosmic Noise
Summary: Dong ....  Dong ....  Do I hear the death-knell of relativity?
Keywords: space, curvature, nothing, tesla
Nntp-Posting-Host: teal.csn.org
Organization: 4-L Laboratories
Distribution: World
Expires: Wed, 28 Apr 1993 06:00:00 GMT
Lines: 30

In article <C4KvJF.4qo@well.sf.ca.us> metares@well.sf.ca.us (Tom Van Flandern) writes:
>crb7q@kelvin.seas.Virginia.EDU (Cameron Randale Bass) writes:
>> Bruce.Scott@launchpad.unc.edu (Bruce Scott) writes:
>>> "Existence" is undefined unless it is synonymous with "observable" in
>>> physics.
>> [crb] Dong ....  Dong ....  Dong ....  Do I hear the death-knell of
>> string theory?
>
>     I agree.  You can add "dark matter" and quarks and a lot of other
>unobservable, purely theoretical constructs in physics to that list,
>including the omni-present "black holes."
>
>     Will Bruce argue that their existence can be inferred from theory
>alone?  Then what about my original criticism, when I said "Curvature
>can only exist relative to something non-curved"?  Bruce replied:
>"'Existence' is undefined unless it is synonymous with 'observable' in
>physics.  We cannot observe more than the four dimensions we know about."
>At the moment I don't see a way to defend that statement and the
>existence of these unobservable phenomena simultaneously.  -|Tom|-

"I hold that space cannot be curved, for the simple reason that it can have
no properties."
"Of properties we can only speak when dealing with matter filling the
space. To say that in the presence of large bodies space becomes curved,
is equivalent to stating that something can act upon nothing. I,
for one, refuse to subscribe to such a view." - Nikola Tesla

----
ET  "Tesla was 100 years ahead of his time. Perhaps now his time comes."
----
Each document is a text written in English in a form of an email with a lot of punctuations. You should always do some pre-processing but here we’ll just concentrate on the model.
Define training function
While training and building a model keep in mind that the first model is never the best one, so the best practice is the “trial and error” method. To make that process simpler, you should create a function for training and in each attempt save results and accuracies. You can define it like this:
from sklearn.model_selection import train_test_split
import time

def train(classifier, X, y):
    start = time.time()
    X_train, X_test, y_train, y_test = train_test_split(X, y, test_size=0.2, random_state=11)

    classifier.fit(X_train, y_train)
    end = time.time()

    print("Accuracy: " + str(classifier.score(X_test, y_test)) + ", Time duration: " + str(end - start))
    return classifier
Function tran_test_split() randomly separates data into training and testing dataset, while function fit() trains the classifier with selected training data (it defines model which parameters match the model input with an output) and score() gives us the accuracy for testing data. Function time() is here just to give us some information about the training duration.
Feature extraction
Like in every machine learning problem, you have to extract features in order to train a model. These algorithms can read-in just numbers and you have to find a way to convert the text into the numerical feature vectors.
If you think about it, a text is just a series of ordered words that usually carry some meaning. If we take each unique word from all the available texts, we’ll create our own vocabulary. And every word in a vocabulary can be one feature. For each text, feature vector will be an array where feature values are simply the numbers of unique word repetition in a specific text, i.e. just the count of each word in one text. And if some word is not in the text, its feature value is zero. Therefore, the word order in a text is not important, just the number of repetitions. This method is called a “Bag of words” and it’s quite common and simple to use.
You can use different approaches for word scores/values, but the most popular one is TF-IDF (Term Frequencies times Inverse Document Frequency), which calculates the frequency of a word in a document and reduces the weight of such common words like “the” or “is”. In one of the next articles, we’ll explain the “Bag of words” method more thoroughly and compare it to other text feature extraction methods. But here we’ll just use scikit-learn build-in function TfidfVectorizer() and highlight the most important words from each text.
Build a text classifier
Now let’s build a classifier! We’ll start with the most common one: the multinomial Naive Bayes classifier which is suitable for discrete classification. Scikit-learn has a great Class called Pipeline, which allows us to a create pipeline for a classifier, i.e. you can just add the functions that you wanna use on your input data. Here, we are using a TfidfVectorizer() as vectorizer and Multinomial as classifier:
from sklearn.naive_bayes import MultinomialNB
from sklearn.pipeline import Pipeline
from sklearn.feature_extraction.text import TfidfVectorizer

trial1 = Pipeline([ ('vectorizer', TfidfVectorizer()), ('classifier', MultinomialNB())])

train(trial1, news.data, news.target)
Output:
Accuracy: 0.853846153846, Time duration: 5.3866918087
Parameter scaling
We achieved great accuracy for the first attempt! But let’s try to improve it. We can remove stop words, i.e. tell TF-IDF to ignore most common words (see explanation in our previous article) with an parameter stop_words. List of stop words can be found in nltk:
from nltk.corpus import stopwords

trial2 = Pipeline([ ('vectorizer', TfidfVectorizer(stop_words=stopwords.words('english'))),('classifier', MultinomialNB())])

train(trial2, news.data, news.target)
Output:
Accuracy: 0.880636604775, Time duration: 5.22666096687
Accuracy is better and even the training is faster, but the alpha parameter of the Naive-Bayes classifier is still the default one, so let’s change its value and iterate through a range of values:
for alpha in [5, 0.5, 0.05, 0.005, 0.0005]:
    trial3 = Pipeline([('vectorizer', TfidfVectorizer(stop_words=stopwords.words('english'))),('classifier', MultinomialNB(alpha=alpha))])

train(trial3, news.data, news.target)
Output:
Accuracy: 0.890981432361, Time duration: 5.7222969532
Accuracy: 0.912201591512, Time duration: 5.62339401245
Accuracy: 0.9175066313, Time duration: 5.51641702652
Accuracy: 0.916976127321, Time duration: 5.60582304001
We can see that the best accuracy of 91.178% is achieved for alpha 0.005. Let’s ignore the words that appear fewer than 5 times in all documents and use min_dif parameter:
trial4 = Pipeline([ ('vectorizer', TfidfVectorizer(stop_words=stopwords.words('english'), min_df=5)), ('classifier', MultinomialNB(alpha=0.005)) ])

train(trial4, news.data, news.target)
Output:
Accuracy: 0.910079575597, Time duration: 5.85248589516
Resulting accuracy is a bit lower, so this was a bad idea. We can try and stem the data with nltk (i.e. reduce inflected words to their word root, read more about it in previous article) with use of parameter tokenizer within TfidfVectorizer, it usually helps, and we can add punctuations to a list of stop words:
import string
from nltk.stem import PorterStemmer
from nltk import word_tokenize

def stemming_tokenizer(text):
    stemmer = PorterStemmer()
    return [stemmer.stem(w) for w in word_tokenize(text)]

trial5 = Pipeline([ ('vectorizer', TfidfVectorizer(tokenizer=stemming_tokenizer, stop_words=stopwords.words('english') + list(string.punctuation))), ('classifier', MultinomialNB(alpha=0.005))])

train(trial5, news.data, news.target)
Output:
Accuracy: 0.922811671088, Time duration: 171.798969984
Accuracy is a bit better, but the training last 34 times longer. This is a great example of time consumption created by stemming. Sometimes accuracy can cost you computation speed and you should find a nice balance between them. Don’t stem if the accuracy doesn’t improve significantly.
Try different classifiers
Now, let’s try some other usual text classifier like Support Vector Classification with stochastic gradient descent and linear SVC. They are initially slower but maybe they can get us better accuracy without a use of stemmer:
from sklearn.linear_model import SGDClassifier
from sklearn.svm import LinearSVC

for classifier in [SGDClassifier(), LinearSVC()]:
    trial6 = Pipeline([('vectorizer', TfidfVectorizer(stop_words=stopwords.words('english') + list(string.punctuation))), ('classifier', classifier)])

train(trial6, news.data, news.target)
Output:
Accuracy: 0.927055702918, Time duration: 6.2128059864
Accuracy: 0.932095490716, Time duration: 8.53486895561
Great! An accuracy of 93.2% for linear SVC is awesome! Acceptable accuracy depends on the specific problem: type/length of the analysed text, number of categories and differences between them, etc. Here, an accuracy of 93% is good because we have 20 categories and some of them are quite similar, like comp.sys.ibm.pc.hardware and comp.sys.mac.hardware in comparison with alt.atheism.
Model evaluation
You can continue to play with parameters and models, but we will stop here and check the characteristics of the best model. We will use confusion_matrix() from sckit-learn to compare real and predicted categories:
from sklearn.metrics import confusion_matrix
import matplotlib.pyplot as plt

start = time.time()
classifier = Pipeline([('vectorizer', TfidfVectorizer(stop_words=stopwords.words('english') + list(string.punctuation))),('classifier', LinearSVC(C=10))])
X_train, X_test, y_train, y_test = train_test_split(news.data, news.target, test_size=0.2, random_state=11)
classifier.fit(X_train, y_train)
end = time.time()

print("Accuracy: " + str(classifier.score(X_test, y_test)) + ", Time duration: " + str(end - start))

y_pred = classifier.predict(X_test)
conf_mat = confusion_matrix(y_test, y_pred)

# Plot confusion_matrix
fig, ax = plt.subplots(figsize=(15, 10))
sns.heatmap(conf_mat, annot=True, cmap = "Set3", fmt ="d",
xticklabels=labels, yticklabels=labels)
plt.ylabel('Actual')
plt.xlabel('Predicted')
plt.show()
Output:
Accuracy: 0.935278514589, Time duration: 16.3250808716

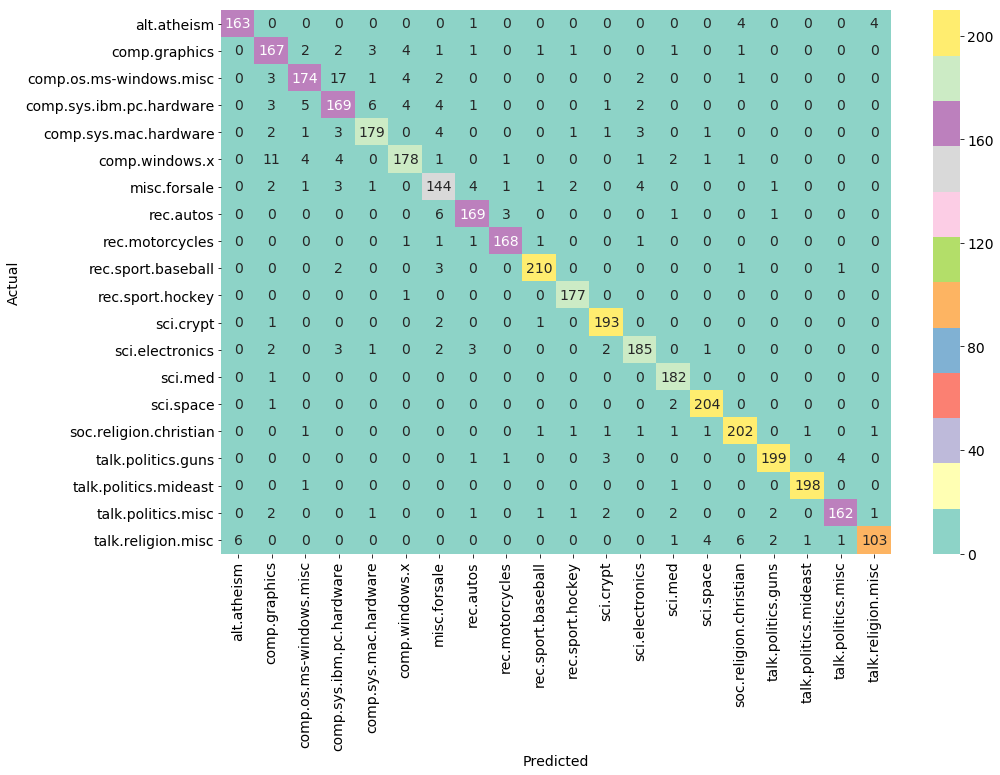
The confusion matrix is a great way to see which categories model is mixing. For example, there are 17 articles from category comp.os.ms-windows.mics that are wrongly classified as comp.sys.ibm.pc.hardware. Also, let’s check the accuracy of each category separately with classification_report():
from sklearn import metrics
print(metrics.classification_report(y_test, y_pred, target_names=labels))
Output:
                            precision    recall  f1-score   support

             alt.atheism       0.96      0.95      0.96       172
           comp.graphics       0.86      0.91      0.88       184
 comp.os.ms-windows.misc       0.92      0.85      0.89       204
comp.sys.ibm.pc.hardware       0.83      0.87      0.85       195
   comp.sys.mac.hardware       0.93      0.92      0.93       195
          comp.windows.x       0.93      0.87      0.90       204
            misc.forsale       0.85      0.88      0.86       164
               rec.autos       0.93      0.94      0.93       180
         rec.motorcycles       0.97      0.97      0.97       173
      rec.sport.baseball       0.97      0.97      0.97       217
        rec.sport.hockey       0.97      0.99      0.98       178
               sci.crypt       0.95      0.98      0.96       197
         sci.electronics       0.93      0.93      0.93       199
                 sci.med       0.94      0.99      0.97       183
               sci.space       0.96      0.99      0.97       207
  soc.religion.christian       0.94      0.96      0.95       211
      talk.politics.guns       0.97      0.96      0.96       208
   talk.politics.mideast       0.99      0.99      0.99       200
      talk.politics.misc       0.96      0.93      0.94       175
      talk.religion.misc       0.94      0.83      0.88       124

             avg / total       0.94      0.94      0.94      3770
Category misc.forsale has the lowest accuracy, but the overall accuracy is great.
As you can see, text classification is pretty simple to implement with existing tools and it can bring a lot of value to various IT projects. It is especially simple to implement if you have an initial dataset which is annotated. When you are creating a classifier, you should play with different methods and models. Try various vectorizers, classifiers, stemmers and model parameters - options are unlimited, so try as many as you can! Sometimes better accuracy could cost you too much time, so check if it’s really necessary and try to find the best balance between the computational speed and accuracy.

